SHOPIFY VIRTUAL TRY-ON CASE STUDY
From a personal preview to the cart.
At one Shopify clothing store, successful try-ons were followed by an 11.8% add-to-cart rate.
One store · Sep 6 to Oct 5, 2026
Observed add-to-cart rate compared with the adjusted baseline.
Observational comparison, not an A/B test.The comparison, at a glance.
Share of shopper-product pairs that added the same product to cart.
Baseline weighted to the same product mix. Both groups had a complete 24-hour observation window.
- Shopper-product pairs with a successful try-on
- 102
- Pairs that then added the product to cart
- 12
- Window after the first successful try-on
- 24h
A useful signal.
A starting point.
In this sample, the observed cart rate was higher among shopper-product pairs with a successful try-on, even after matching the baseline to their product mix.
Shoppers who choose try-on may already have greater buying intent. This comparison does not prove that Wearbly caused a conversion increase. Cart additions are not purchases or revenue.
THE SHOPPER EXPERIENCE
See it on themselves.
Keep shopping.
- Choose a garment.Start on your Shopify product page.
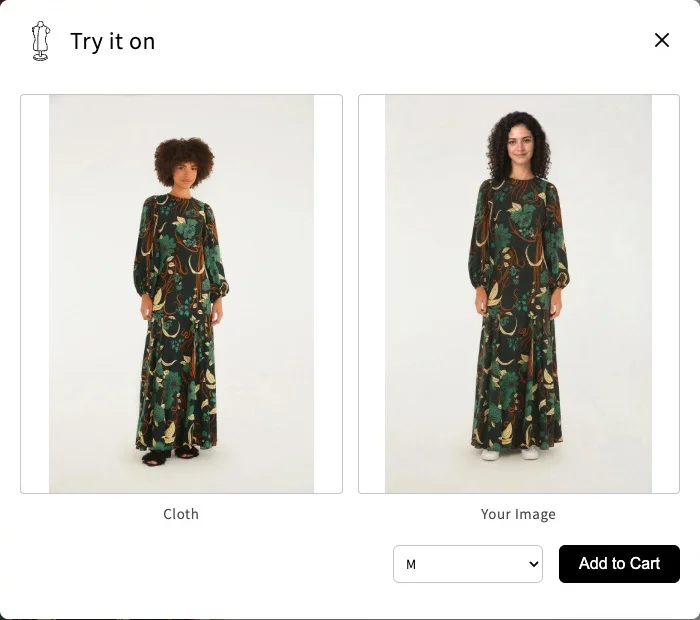
- Make it personal.Upload a photo and generate an outfit preview.
- Add it to the cart.Keep the selected size and color in the same flow.
How we measured the results
The sample
Sep 6 to Oct 5, 2026, in America/Sao_Paulo. The 102 shopper-product pairs represented 63 shopper identifiers, not 102 individual people. Of those pairs, 12 added the same product to cart within 24 hours after their first successful try-on. Repeated try-ons for the same pair were counted once.
The comparison
The baseline uses product views without a successful try-on, weighted to the same product mix. Both groups had a complete 24-hour observation window; new pairs from the final day were excluded. Cart events before the first successful try-on were not attributed to Wearbly. Rates are rounded for display; the unrounded rate ratio was 2.496, displayed as 2.5×.
The limits
One store, a small sample and an observational comparison. Shopify consent and event availability can affect what is measured. A controlled experiment with comparable groups is needed to estimate a causal conversion increase. These results are not a forecast for another store.
See the activity in your own store.
Wearbly’s Shopify dashboard tracks successful try-ons and attributed cart activity. Start with your products and measure how shoppers use the preview.